Nuclear Energy: Challenges and Necessities
Nuclear Energy: Challenges and Necessities
Salman M Salman, Alquds University, Jerusalem, Palestine (2009)
Scope and Objectives
- A review of the energy needs and resources.
- Problems, Hazards and Benefits of the Various Energy Sources.
- Problems and solutions to the Nuclear Energy Production.
- Nuclear Energy Resources & Technologies and Absence of Arabs Share.
- Review of the Basic Technology of Portable Nuclear Reactors.
- Global Nuclear Energy Partnership (GNEP).
I. Energy Needs & Resources and the Need for Nuclear Energy.
Table 1: basic World energy parameters
| Parameter | Value |
| Total world energy consumption per year | E= 5* 1020 Jules = 1.4 *10 13 kwh. |
| Total earth sun energy/year | Es = 5* 1024 Jules= 1.4 *10 17 kwh |
| Humanity consumption ratio | ~ 10-4 of Sun input. |
| Average world energy consumption/capita | 8.2 * 109 Jules per year (~3000kwh) |
| Average world energy cost per kWh | 0.2 $ |
| Total world energy bill per year | 2.8 * 1012 $ (2008) |
Table 2: Resources distributed according to consumption category
| Services | 15% |
| Households | 25% |
| Industries | 30% |
| Transport | 30% |
Table 3: Distributed according to energy sources
| Nuclear | 15% |
| Oil | 30% |
| Coal | 30% |
| Other | 25% |
Table 4 Production total and efficiency, Nuclear share 16% (kwe (electric) ~1/3 kwt)
| U form | Kwh/kg | notes |
| Pure U | 106 | 1 ref. |
| U3O8 67k ton/year | 3×10⁴ | 3×10⁻² moderate |
| Enriched UO2 | 3×10² | 3×10⁻⁴ low eff. |
| Total nuclear energy production | 2.658x 10⁹ kwh |
Table 5: Annual World energy resources and consumption
| Fuel type | Power in TW | Energy/year in EJ = 1018J |
| Oil | 5.6 | 180 |
| Gas | 3.5 | 110 |
| Coal | 3.8 | 120 |
| Hydroelectric | 0.9 | 30 |
| Nuclear | 0.9 | 30 |
| Geothermal, wind, solar, wood | 0.13 | 4 |
| Total | 15 | 471 |
Table 6: Remaining world reserves of conventional fossil fuels estimates
| Fuel | Energy reserves in ZJ = 1021 |
| Coal | 290 |
| Oil | 18.4 |
| Gas | 15.7 |
Table 7: Existing resources of energy of the type
| Type | (Jules/kg) | kwh ($) | Available (Jules) | Years at current share | World years stand alone |
| Oil | 106 | .3 | 18*1021 | 100 | 36 |
| Coal | <106 | .1 | 290*1021 | 2500 | 600 |
| Nuclear | 4*1013 ideal
1010 actual |
.05 | 250*1021 ideal | 3000 ideal
75 actual |
500 ideal
15 actual |
II. Problems, hazards, and benefits of the various energy sources
With an indication of the best rating for renewable energy and then nuclear energy.
Table 8: Problem based on energy source type
| Type | Problems |
| Oil & Gas | Short span, political vitality, pollution, high cost, hazards |
| Coal | hazards, inefficient, pollution |
| Nuclear | Public rejection, rare high risks, waste p, inefficient, high investment cost |
| Hydraulic | Environmental changes, high risks, immovability |
| Solar & Wind | Low power, inefficient, limited applications |
| other | Limited power output |
Table 9: Advantages based on energy source type
| Type | Advantages |
| Oil & Gas | Technology setup, mobility, industry based |
| Coal | Cheap, hard mobility |
| Nuclear | low running cost, low pollution, low risk rates, medium portability |
| Hydraulic | Long terms span |
| Solar & Wind | Very long term, renewable, small pollution |
| other | Local advantages. |
The April 1986 disaster at the Chernobyl nuclear power plant in the Ukraine was the result of major design deficiencies in the RBMK type of reactor, the violation of operating procedures and the absence of a safety culture.
One peculiar feature of the RBMK design was that coolant failure could lead to a strong increase in power output from the fission process ( positive void coefficient). However, this was not the prime cause of the Chernobyl accident.
The accident destroyed the reactor and killed 56 people, 28 of whom died within weeks from radiation exposure. It also caused radiation sickness in a further 200-300 staff and firefighters, and contaminated large areas of Belarus, Ukraine, Russia and beyond. It is estimated that at least 5% of the total radioactive material in the Chernobyl-4 reactor core was released from the plant, due to the lack of any containment structure.
About 130,000 people received significant radiation doses (i.e. above internationally accepted ICRP limits) and are being closely monitored. About 4000 cases of thyroid cancer in children have been linked to the accident. Most of these were curable, though about nine have been fatal. No increase in leukemia or other cancers have yet shown up, but some is expected.
The Chernobyl accident was a unique event and the only time in the history of commercial nuclear power that radiation-related fatalities occurred.
An OECD expert report on it concluded that “the Chernobyl accident has not brought to light any new, previously unknown phenomena or safety issues that are not resolved or otherwise covered by current reactor safety programs for commercial power reactors in OECD Member countries.”
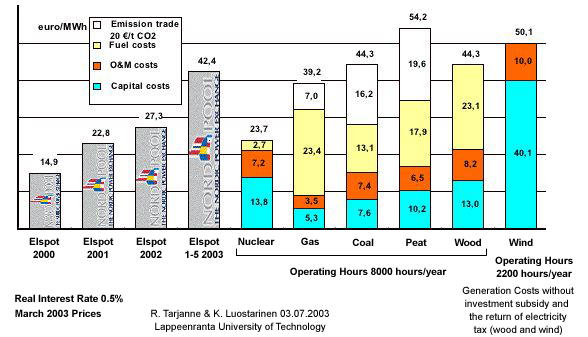
Table 10: Electricity cost (US cent/kWh)
| Source | MIT 2003 | France 2003 | UK 2004 | Chicago 2004 | Canada 2004 | EU 2007 |
| Nuclear | 4.2 | 3.7 | 4.6 | 4.2 – 4.6 | 5.0 | 5.4 – 7.4 |
| Coal | 4.2 | 5.2 | 3.5 – 4.1 | 4.5 | 4.7 – 6.1 | |
| Gas | 5.8 | 5.8, 10.1 | 5.9, 9.8 | 5.5 – 7.0 | 7.2 | 4.6 – 6.1 |
| Wind onshore | 7.4 | 4.7 – 14.8 | ||||
| Wind offshore | 11.0 | 8.2 – 20.2 |
III. Resources, Problems and Solutions Nuclear Energy Production
III.1 Highlights
- Cost of building reactors at about 3-5k$ /kwh with about 3-5 b$ + about 4 B for clean up investment cost is about 7b
- Today there are some 457 up to 2010 nuclear power reactors operating in 30 countries, with a combined capacity of about 384+ GWe. In 2006 these provided 2658 billion kWh, about 16% of the world’s electricity.
- Nuclear power capacity worldwide is increasing steadily, Significant further capacity is being created by plant upgrading. Plant life extension.
- About 38 power reactors are currently being constructed, notably in China, South Korea, Japan and Russia.
III.2 Nuclear Power Reactors Components
Fuel
Usually pellets of uranium oxide (UO2) arranged in tubes to form fuel rods. The rods are arranged into fuel assemblies in the reactor core.
- The world’s power reactors, with combined capacity of some 380 GWe, require about 67,000 tons of uranium each year. While this capacity is being run more productively, The factors increasing fuel demand are offset by a trend for higher burn up of fuel and other efficiencies, so demand is steady. (Over the 18 years to 1993 the electricity generated by nuclear power increased 5.5-fold while uranium used increased only just over 3-fold.)
- Reducing the tails assay in enrichment reduces the amount of natural uranium required for a given amount of fuel.
- Reprocessing of spent fuel from conventional light water reactors also utilizes present resources more efficiently, by a factor of about 1.3 overall.
- Nuclear Weapons as a source of fuel
- Thorium as a nuclear fuel Today uranium is the only fuel supplied for nuclear reactors. However, thorium can also be utilized as a fuel for CANDU reactors or in reactors specially designed for this purpose.
Moderators
This is material which slows down the neutrons released from fission so that they cause more fission. It is usually water, but may be heavy water or graphite.
Control rods
These are made with neutron-absorbing material such as cadmium, hafnium or boron, and are inserted or withdrawn from the core to control the rate of reaction, or to halt it. (Secondary shutdown systems involve adding other neutron absorbers, usually as a fluid, to the system.)
Coolant
A liquid or gas circulating through the core so as to transfer the heat from it. . In light water reactors the water moderator functions also as primary coolant. Except in BWRs, there is secondary coolant.
Pressure vessel or pressure tubes
Usually a robust steel vessel containing the reactor core and moderator/coolant, but it may be a series of tubes holding the fuel and conveying the coolant through the moderator.
Steam generator
Part of the cooling system where the heat from the reactor is used to make steam for the turbine.
Containment
The structure around the reactor core which is designed to protect it from outside intrusion and to protect those outside from the effects of radiation in case of any malfunction inside. It is typically a meter-thick concrete and steel structure.
There are several different types of reactors as indicated in the following table.
III.3 Types of Reactors
Most nuclear electricity is generated using just two kinds of reactors which were developed in the 1950s and improved since. New designs are coming forward and some are in operation as the first generation reactors come to the end of their operating lives.
- Pressurized Water Reactors (PWR).
- Boiling Water Reactors (BWR).
- Pressurized Heavy Water Reactors (PHWR or CANDU).
- Advanced Gas-cooled Reactors (AGR).
- Fast neutron reactors.
- Floating nuclear power plants.
III.4 Economics of Nuclear Power
Capital investments
Cost of building reactors at about 3-5k$ /kwh with about 3-5 b$ + about 5b$ for clean up investment cost is about 10b$.
External costs
The report of a major European study of the external costs of various fuel cycles, focusing on coal and nuclear, was released in mid 2001. It shows that nuclear energy incurs about one tenth of the costs of coal. The external costs are defined as those actually incurred in relation to health and the environment and quantifiable but not built into the cost of the electricity. If these costs were in fact included, the EU price of electricity from coal would double and that from gas would increase 30%. These are without attempting to include global warming.
Material and production costs
Table 11: Cost (US$, 2007) to get 1 kg of Uranium as UO2 reactor fuel
| Operation | Amount | Total cost $ |
| Uranium compound | 8.9 kg U3O8 x $53 | 472 |
| Conversion | 7.5 kg U x $12 | 90 |
| Enrichment | 7.3 SWU x $135 | 985 |
| Fuel fabrication | per kg | 240 |
| Total | US$ 1787 | |
| At 45,000 MWd/t burn-up this gives 360,000 kwh electrical, hence fuel cost: 0.50 c/kwh. | ||
III.5 Safety of Nuclear Power Reactors
- There has been a strong awareness of the potential hazard of both nuclear criticality and release of radioactive materials.
- Three major reactor accidents in the history of civil nuclear power – Three Mile Island, was contained without harm and Chernobyl, involved an intense fire without provision for containment. Then Fukushima daiichi.
- These are the only major accidents to have occurred in more than 12,700 cumulative reactor-years of commercial operation in 32 countries.
- The risks of an accident, are minimal compared with other commonly accepted risks. Nuclear power plants are very robust.
Safety
Focuses on unintended conditions or events leading to radiological releases from authorized activities. It relates mainly to intrinsic problems or hazards. Security
Focuses on the intentional misuse of nuclear or other radioactive materials by non-state elements to cause harm. It relates mainly to external threats to materials or facilities.
Safeguards
focus on restraining activities by states that could lead to acquisition of nuclear weapons. It concerns mainly materials and equipment in relation to rogue governments.
Achieving optimum nuclear safety
Nuclear plants operate using a ‘defense-in-depth’ approach, with multiple safety systems supplementing the natural features of the reactor core. Key aspects of the approach are:
- high-quality design & construction
- equipment which prevents operational disturbances developing into problems
- redundant and diverse systems to detect problems, control damage to the fuel and prevent significant radioactive releases
- provision to confine the effects of severe fuel damage to the plant itself.
Table 12: Comparison of accident statistics in primary energy production.
| Electricity generation accounts for about 40% of total primary energy | |||
| Fuel | Immediate fatalities 1970-92 |
Who? | Normalized to deaths per TWy* electricity |
| Coal | 6400 | workers | 342 |
| Natural gas | 1200 | workers & public | 85 |
| Hydro | 4000 | public | 883 |
| Nuclear | 56 | workers | 8 |
IV. Nuclear Energy Resources & Technologies and Absence of Arabs Share
Table 13: Known Recoverable Resources of Uranium 2009
| Country | Tones U | Percentage of world |
| Australia | 1,673,000 | 31% |
| Kazakhstan | 651,000 | 12% |
| Canada | 485,000 | 9% |
| Russia | 480,000 | 9% |
| South Africa | 295,000 | 5% |
| Namibia | 284,000 | 5% |
| Brazil | 279,000 | 5% |
| Niger | 272,000 | 5% |
| USA | 207,000 | 4% |
| China | 171,000 | 3% |
| Jordan | 112,000 | 2% |
| Uzbekistan | 111,000 | 2% |
| Ukraine | 105,000 | 2% |
| India | 80,000 | 1.5% |
| Mongolia | 49,000 | 1% |
| other | 150,000 | 3% |
| World total | 5,404,000 | 100% |
Reasonably Assured Resources plus Inferred Resources, to US$ 130/kg U, 1/1/09, from OECD NEA & IAEA, Uranium 2009: Resources, Production and Demand (“Red Book”).
Table 14: Production from mines (ton U)
| Country | 2002 | 2003 | 2004 | 2005 | 2006 |
| Canada | 11604 | 10457 | 11597 | 11628 | 9862 |
| Australia | 6854 | 7572 | 8982 | 9516 | 7593 |
| Kazakhstan | 2800 | 3300 | 3719 | 4357 | 5279 |
| Niger | 3075 | 3143 | 3282 | 3093 | 3434 |
| Russia (est) | 2900 | 3150 | 3200 | 3431 | 3262 |
| Namibia | 2333 | 2036 | 3038 | 3147 | 3067 |
| Uzbekistan | 1860 | 1598 | 2016 | 2300 | 2260 |
| USA | 919 | 779 | 878 | 1039 | 1672 |
| Ukraine (est) | 800 | 800 | 800 | 800 | 800 |
| China (est) | 730 | 750 | 750 | 750 | 750 |
| South Africa | 824 | 758 | 755 | 674 | 534 |
| Czech Repub. | 465 | 452 | 412 | 408 | 359 |
| India (est) | 230 | 230 | 230 | 230 | 177 |
| Brazil | 270 | 310 | 300 | 110 | 190 |
| Romania (est) | 90 | 90 | 90 | 90 | 90 |
| Germany | 212 | 150 | 150 | 77 | 50 |
| Pakistan (est) | 38 | 45 | 45 | 45 | 45 |
| France | 20 | 0 | 7 | 7 | 5 |
| Total world | 36 063 | 35 613 | 40 251 | 41 702 | 39 429 |
| tons U3O8 | 42 529 | 41 998 | 47 468 | 49 179 | 46 499 |
Table 15: Nuclear power plants in commercial operation
| Reactor Type | Main Countries | Number | GWe | Fuel | Coolant | Moderator |
| Pressurized Water Reactor (PWR) | US, France, Japan, Russia | 264 | 250.5 | enriched UO2 | water | water |
| Boiling Water Reactor (BWR) | US, Japan, Sweden | 94 | 86.4 | enriched UO2 | water | water |
| Pressurized Heavy Water Reactor ‘CANDU’ (PHWR) | Canada | 43 | 23.6 | natural UO2 | heavy water | heavy water |
| Gas-cooled Reactor (AGR & Magnox) | UK | 18 | 10.8 | natural U, enriched UO2 |
CO2 | graphite |
| Light Water Graphite Reactor (RBMK) | Russia | 12 | 12.3 | enriched UO2 | water | graphite |
| Fast Neutron Reactor (FBR) | Japan, France, Russia | 4 | 1.0 | PuO2 and UO2 | liquid sodium | none |
| Other | Russia | 4 | 0.05 | enriched UO2 | water | graphite |
| TOTAL | 439 | 384.6 |
Table 16: World Nuclear Power Reactors 2006-07 and Uranium Requirements
| NUCLEAR ELECTRICITY GENERATION 2006 | REACTORS OPERABLE October 2007 | REACTORS UNDER CONSTRUCTION October 2007 | REACTORS PLANNED October 2007 | REACTORS PROPOSED October 2007 | URANIUM REQUIRED 2007 | ||||||
| billion kWh | % e | No. | MWe | No. | MWe | No. | MWe | No. | MWe | tones U | |
| WORLD | 2658 | 16 | 439 | 372,002 | 33 | 26,838 | 94 | 101,595 | 222 | 193,095 | 66,529 |
Plans For New Reactors Worldwide
- Cost of building reactors at about 3-5k$ /kwh with about 3-5 b$ + about 4 B for clean up investment cost is about 7b
- Today there are some 457 up to 2010 nuclear power reactors operating in 30 countries, with a combined capacity of about 384+ GWe. In 2006 these provided 2658 billion kWh, about 16% of the world’s electricity.
- Nuclear power capacity worldwide is increasing steadily but not dramatically, Significant further capacity is being created by plant upgrading. Plant life extension.
- About 38 power reactors are currently being constructed (see Table below), notably in China, South Korea, Japan and Russia.
Table 17: Power reactors under construction 2007
| Start Operation* | REACTOR | TYPE | MWe (net) | |
| 2011 | Russia, Rosenergoatom | Severodvinsk | PWR x 2 | 70 |
| 2011 | Finland, TVO | Olkilouto 3 | PWR | 1600 |
| 2011 | Russia, Rosenergoatom | Kalinin 4 | PWR | 950 |
| 2011 | Korea, KHNP | Shin Kori 2 | PWR | 1000 |
| 2011 | Korea, KHNP | Shin Wolsong 1 | PWR | 1000 |
| 2011 | China, CNNC | Qinshan 6 | PWR | 650 |
| 2011 | China, CGNPC | Lingao 4 | PWR | 1000 |
| 2011 | Pakistan, PAEC | Chashma 2 | PWR | 300 |
| 2011 | Russia, Rosenergoatom | Kursk 5 | RBMK | 1000 |
| 2012 | China, CNNC | Qinshan 7 | PWR | 650 |
| 2012 | Korea, KHNP | Shin Wolsong 2 | PWR | 1000 |
| 2012 | France, EdF | Flamanville 3 | PWR | 1630 |
| 2012 | Russia, Rosenergoatom | Beloyarsk 4 | FBR | 750 |
| 2012 | Japan, Chugoku | Shimane 3 | PWR | 1375 |
| 2012 | Russia, Rosenergoatom | Novovoronezh 6 | PWR | 1070 |
| 2012 | Slovakia, SE | Mochovce 3 | PWR | 440 |
| 2012 | China, CGNPC | Hongyanhe 1 | PWR | 1080 |
| 2012 | China, CGNPC | Ningde 1 | PWR | 1080 |
| 2013 | China, CNNC | Sanmen 1 | PWR | 1100 |
| 2013 | China, CGNPC | Ningde 2 | PWR | 1080 |
| 2013 | Russia, Rosenergoatom | Leningrad 5 | PWR | 1070 |
| 2013 | Russia, Rosenergoatom | Novovoronezh 7 | PWR | 1070 |
| 2013 | Korea, KHNP | Shin Kori 3 | PWR | 1350 |
| 2013 | China, CGNPC | Hongyanhe 2 | PWR | 1080 |
| 2013 | China, CGNPC | Yangjiang 1 | PWR | 1080 |
| 2013 | Japan, EPDC/J Power | Ohma | ABWR | 1350 |
| 2013 | Japan, Tepco | Fukishima I-6 | ABWR | 1350 |
| 2013 | Slovakia, SE | Mochovce 4 | PWR | 440 |
| 2014 | China , CNNC | Sanmen 2 | PWR | 1100 |
| 2014 | China , CPI | Haiyang 1 | PWR | 1100 |
| 2014 | China , CGNPC | Ningde 3 | PWR | 1080 |
| 2014 | China , CGNPC | Yangjiang 2 | PWR | 1080 |
| 2014 | China , CGNPC | Hongyanhe 3 | PWR | 1080 |
| 2014 | Korea, KHNP | Shin-Kori 4 | PWR | 1350 |
| 2014 | Russia , Rosenergoatom | Leningrad 6 | PWR | 1200 |
| 2014 | Russia , Rosenergoatom | Volgodonsk 3 | PWR | 1200 |
| 2014 | Japan , Tepco | Fukishima I-7 | ABWR | 1080 |
| 2014 | Japan , Tepco | Higashidori 1 | ABWR | 1080 |
V. Review Basic of Portable Nuclear Reactors Technology
V.1 Specifications
SSTAR = a small, sealed, transportable, autonomous reactor.
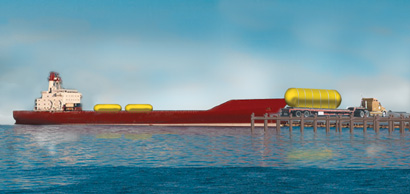
10-100 mwe and 30 years span. Portable 500 tons.
Total cost for 1 kwh energy production = $.005 – .01
Nuclear naval submarines and carriers since 1940s.
Most commercial nuclear reactors are large light-water reactors (LWRs) designed to generate 1,000 megawatts electric (MWe) or more. Significant capital investments are required to build these reactors and manage the nuclear fuel cycle. Many developing countries do not need such large increments of electricity.
![]() The SSTAR design will provide a tamper-resistant reactor. after its operation, the sealed reactor will be returned to a secure recycling facility for refueling or maintenance.
The SSTAR design will provide a tamper-resistant reactor. after its operation, the sealed reactor will be returned to a secure recycling facility for refueling or maintenance.
![]() Designed to be deployable anywhere in the world, SSTAR may also meet a national need. In the U.S., the Nuclear Regulatory Commission (NRC) oversees more than 100 nuclear power plants that were built during the 1960s and 1970s. SSTAR would provide a secure and cost-effective system to replace older nuclear reactors as well as aging fossil-fuel plants, particularly in an isolated location.
Designed to be deployable anywhere in the world, SSTAR may also meet a national need. In the U.S., the Nuclear Regulatory Commission (NRC) oversees more than 100 nuclear power plants that were built during the 1960s and 1970s. SSTAR would provide a secure and cost-effective system to replace older nuclear reactors as well as aging fossil-fuel plants, particularly in an isolated location.
![]() SSTAR is designed as a lead-cooled fast reactor (LFR) that can supply 10 to 100 MWe with a reactor system that can be transported in a shipping cask. Fast reactors typically use liquid metal coolants, such as lead, lead–bismuth, or sodium, instead of water. Neutron kinetic energy is about 250 kilo electron volts in LFRs—much greater than in LWRs, where the low mass of hydrogen in the water coolant slows neutron velocity and, thus, energy to about 0.025 to 0.05 electronvolt. With fast-moving neutrons, SSTAR could produce the fissile material it needs to fuel continued operation at the same time that it generates energy. Spent fuel in the form of uranium and plutonium would remain in the reactor to generate power for up to 30 years.
SSTAR is designed as a lead-cooled fast reactor (LFR) that can supply 10 to 100 MWe with a reactor system that can be transported in a shipping cask. Fast reactors typically use liquid metal coolants, such as lead, lead–bismuth, or sodium, instead of water. Neutron kinetic energy is about 250 kilo electron volts in LFRs—much greater than in LWRs, where the low mass of hydrogen in the water coolant slows neutron velocity and, thus, energy to about 0.025 to 0.05 electronvolt. With fast-moving neutrons, SSTAR could produce the fissile material it needs to fuel continued operation at the same time that it generates energy. Spent fuel in the form of uranium and plutonium would remain in the reactor to generate power for up to 30 years.
![]() No refueling is necessary during the reactor’s operation, which eliminates access to and long-term storage of nuclear materials on-site. The design also includes detection and signaling systems to identify actions that threaten the security of the reactor. And because of the reactor’s small size and its thermal and nuclear characteristics, the design can include a passive method to shut down and cool the reactor in response to hardware or control failures.
No refueling is necessary during the reactor’s operation, which eliminates access to and long-term storage of nuclear materials on-site. The design also includes detection and signaling systems to identify actions that threaten the security of the reactor. And because of the reactor’s small size and its thermal and nuclear characteristics, the design can include a passive method to shut down and cool the reactor in response to hardware or control failures.
Reduced Operating Costs
![]() SSTAR also offers potential cost reductions over conventional nuclear reactors. Using lead or lead–bismuth as a cooling material instead of water eliminates the large, high-pressure vessels and piping needed to contain the reactor coolant. The low pressure of the lead coolant also allows for a more compact reactor because the steam generator can be incorporated into the reactor vessel. Plus with no refueling downtime and no spent fuel rods to be managed, the reactor can produce energy continuously and with fewer personnel.
SSTAR also offers potential cost reductions over conventional nuclear reactors. Using lead or lead–bismuth as a cooling material instead of water eliminates the large, high-pressure vessels and piping needed to contain the reactor coolant. The low pressure of the lead coolant also allows for a more compact reactor because the steam generator can be incorporated into the reactor vessel. Plus with no refueling downtime and no spent fuel rods to be managed, the reactor can produce energy continuously and with fewer personnel.
Table 18: Illustrations of the portable reactor size and portability
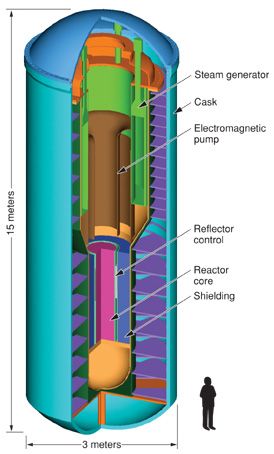 |
Lawrence Livermore, Los Alamos, and Argonne national laboratories are designing a self-contained nuclear reactor with tamper-resistant features. Called SSTAR (small, sealed, transportable, autonomous reactor), this next-generation reactor will produce 10 to 100 megawatts electric and can be safely transported on ship or by a heavy-haul transport truck. In this schematic of one conceptual design being considered, the reactor is enclosed in a transportation cas |
V.2 Tackling the Design Challenges
Must develop materials for the fuel and coolant boundary that are compatible with the coolant. Lead, especially when alloyed with bismuth, tends to corrode the fuel cladding and structural steel. Controlling the oxygen in the coolant will help reduce corrosion.
In addition, the team must identify materials that would best withstand the damaging effects of long-term exposure to fast neutrons. Structural damage could include material swelling and ductility loss, both of which may limit the life of the reactor.
Evaluated a modified design, developed by the Japanese team, for a small liquid metal–cooled reactor using sodium as a coolant.
Passive safety features also will be developed to ensure that any failure in the control system will shut down the reactor and initiate a natural convection system to cool the reactor core and vessel.
must develop packaging and transportation systems so the reactor can be removed safely. must design a process to cool the reactor while it is being shipped to the recycling facility. The design criteria for meeting these challenges may affect the maximum power level that can be achieved.
Table 18b: Illustrations of the portable reactor size and portability
| When it is upright, SSTAR will be about 15 meters high and 3 meters wide, and its total weight will not exceed 500 tons. This compact size will allow the nuclear reactor to be transported on a ship and by a heavy-haul transport truck.
|
VI. Global Nuclear Energy Partnership
- GNEP is a partnership of countries aiming to improve the proliferation-resistance of the nuclear fuel cycle while guaranteeing access to fuel supplies.
- It involves both political and technological initiatives, the latter mainly in relation to reprocessing and burning actinides in fast reactors.
- focused on limiting the spread of enrichment and reprocessing technologies.
VI.1 GNEP work plan- (after new world development I do not encourage this plan 2021)
The 16 GNEP members agreed to set up a nuclear fuel services working group, to address nuclear fuel leasing and other considerations around comprehensive nuclear fuel supply goals. Another working group, on nuclear infrastructure development, would address the financial, technical and manpower challenges surrounding nuclear power deployment in many countries.
An early priority is the development of new reprocessing technologies to enable recycling of most of the used fuel. One of the concerns when reprocessing used nuclear fuel is ensuring that elements separated not be used to create a weapon. One chemical reprocessing technology – PUREX – has been employed for over half a century, having been developed in wartime for military use. This has resulted in the accumulation of 240 tonnes of separated reactor-grade plutonium around the world (though some has been used in mixed oxide fuel). While this is not suitable for weapons use, it is no longer seen as appropriate and future reprocessing will result in the plutonium being combined with some uranium and possibly with minor actinides . GNEP creates a framework where states that currently employ reprocessing technologies can collaborate to design and deploy advanced separations and fuel fabrication techniques that do not result in the accumulation of separated pure plutonium.
Table 19: Nuclear share figures, 1996-2006
| April 2007 | |||||||||||||
| Country or area | Nuclear share (%) | electricity production (TWh) | electricity production (TWh) | ||||||||||
| 1996 | 1997 | 1998 | 1999 | 2000 | 2001 | 2002 | 2003 | 2004 | 2005 | 2006 | 2005 | 2006 | |
| Argentina | 11.4 | 11.4 | 10.0 | 9.0 | 7.3 | 8.2 | 7.2 | 8.6 | 8.2 | 6.9 | 6.9 | 6.4 | 7.1 |
| Armenia | 36.7 | 25.7 | 24.7 | 36.4 | 33.0 | 34.8 | 40.5 | 35.5 | 38.8 | 42.7 | 42.0 | 2.5 | 2.4 |
| Belgium | 57.2 | 60.0 | 55.2 | 57.7 | 55.3 | 58.0 | 57.3 | 55.5 | 55.1 | 55.6 | 54.4 | 45.3 | 44.3 |
| Brazil | 0.7 | 1.1 | 1.1 | 1.1 | 1.4 | 4.3 | 4.0 | 3.6 | 3.0 | 2.5 | 3.3 | 9.8 | 13.8 |
| Bulgaria | 42.2 | 45.4 | 41.5 | 47.1 | 45.0 | 41.6 | 47.3 | 37.7 | 41.6 | 44.1 | 43.6 | 17.3 | 18.1 |
| Canada | 16.0 | 14.1 | 12.4 | 12.4 | 11.8 | 12.9 | 12.3 | 12.5 | 15.0 | 14.6 | 15.8 | 86.8 | 92.4 |
| China: | |||||||||||||
| – Mainland | 1.3 | 0.8 | 1.2 | 1.1 | 1.2 | 1.1 | 1.4 | 2.2 | – | 2.0 | 1.9 | 50.3 | 54.8 |
| – Taiwan | 29.0 | 26.4 | 24.8 | 25.3 | 23.6 | 21.6 | 22.9 | 21.5 | – | – | 19.5 | – | 38.3 |
| Czech Rep | 20.0 | 19.3 | 20.5 | 20.8 | 26.7 | 19.8 | 24.5 | 31.1 | 31.2 | 30.5 | 31.5 | 23.2 | 24.5 |
| Finland | 28.1 | 30.4 | 27.4 | 33.0 | 30.0 | 30.6 | 29.8 | 27.3 | 26.6 | 32.9 | 28.0 | 22.3 | 22.0 |
| France | 77.4 | 78.2 | 75.8 | 75.0 | 76.4 | 77.1 | 78.0 | 77.7 | 78.1 | 78.5 | 78.1 | 430.9 | 428.7 |
| Germany | 30.3 | 30.6 | 28.3 | 31.2 | 34.5 | 30.5 | 29.9 | 28.1 | 32.1 | 31.0 | 31.8 | 154.6 | 158.7 |
| Hungary | 40.8 | 40.8 | 35.6 | 38.3 | 40.6 | 39.1 | 36.1 | 32.7 | 33.8 | 37.2 | 37.7 | 13.0 | 12.5 |
| India | 2.2 | 2.3 | 2.5 | 2.6 | 3.1 | 3.7 | 3.7 | 3.3 | 2.8 | 2.8 | 2.6 | 15.7 | 15.6 |
| Japan | 33.4 | 36.0 | 35.9 | 36.0* | 33.8 | 34.3 | 34.5 | 25.0 | 29.3 | 29.3 | 30.0 | 280.7 | 291.5 |
| Kazakhstan | 0.2 | 0.6 | 0.2 | na | na | na | na | na | na | na | na | na | na |
| Korea, S | 36.3 | 34.1 | 41.4 | 42.8 | 40.9 | 39.3 | 38.6 | 40.0 | 37.9 | 44.7 | 38.6 | 139.3 | 141.2 |
| Lithuania | 83.4 | 81.5 | 77.2 | 73.1 | 73.7 | 77.6 | 80.1 | 79.9 | 72.1 | 69.6 | 72.3 | 10.3 | 7.9 |
| Mexico | 5.1 | 6.5 | 5.4 | 5.2 | 4.5 | 3.7 | 4.1 | 5.2 | 5.2 | 5.0 | 4.9 | 10.8 | 10.4 |
| Netherlands | 4.8 | 2.5 | 4.1 | 4.0 | na | 4.2 | 4.0 | 4.5 | 3.8 | 3.9 | 3.5 | 3.8 | 3.3 |
| Pakistan | 0.6 | 0.7 | 0.6 | 0.1 | 1.7 | 2.9 | 2.5 | 2.4 | 2.4 | 2.8 | 2.7 | 2.4 | 2.5 |
| Romania | 1.8 | 9.7 | 10.3 | 10.7 | 10.3 | 10.5 | 10.3 | 9.3 | 10.1 | 8.6 | 9.0 | 5.1 | 5.2 |
| Russia | 13.1 | 13.6 | 13.1 | 14.4 | 14.9 | 15.4 | 16.0 | 16.5 | 15.6 | 15.8 | 15.9 | 137.3 | 144.3 |
| Slovakia | 44.5 | 44.0 | 43.8 | 47.0 | 53.4 | 53.4 | 65.4 | 57.3 | 55.2 | 56.1 | 57.2 | 16.3 | 16.6 |
| Slovenia | 37.9 | 40.0 | 38.3 | 37.2 | 37.4 | 39.0 | 40.7 | 40.4 | 38.8 | 42.4 | 40.3 | 5.6 | 5.3 |
| S. Africa | 6.3 | 6.5 | 7.2 | 7.1 | 6.7 | 6.7 | 5.9 | 6.0 | 6.6 | 5.5 | 4.4 | 12.2 | 10.1 |
| Spain | 32.0 | 29.3 | 31.7 | 31.0 | 27.8 | 28.8 | 25.8 | 23.6 | 22.9 | 19.6 | 19.8 | 54.7 | 57.4 |
| Sweden | 52.4 | 46.2 | 45.7 | 46.8 | 39.0 | 43.9 | 45.7 | 49.6 | 51.8 | 46.7 | 48.0 | 70.0 | 65.0 |
| Switzerland | 44.5 | 40.6 | 41.1 | 36.0 | 38.2 | 36.0 | 39.5 | 39.7 | 40.0 | 32.1 | 37.4 | 22.1 | 26.4 |
| UK | 26.0 | 27.5 | 27.1 | 28.9 | 21.9 | 22.6 | 22.4 | 23.7 | 19.4 | 19.9 | 18.4 | 75.2 | 69.2 |
| Ukraine | 43.8 | 46.9 | 45.4 | 43.8 | 45.3 | 46.0 | 45.7 | 45.9 | 51.1 | 48.5 | 47.5 | 83.3 | 84.8 |
| USA | 21.9 | 20.1 | 18.7 | 19.8 | 19.8 | 20.4 | 20.3 | 19.9 | 19.9 | 19.3 | 19.4 | 780.5 | 787.2 |
| TOTAL | 2626 | 2658 | |||||||||||
VI.2 Outcomes of GNEP
Nine requirements
- Import of spent fuel for disposal, as well as storage, should be permissible.
- A geological disposal option (not only for spent fuel, but also for vitrified high-level wastes and other long-lived wastes) should be part of the package.
- International acceptability is essential,
- Economic advantages for user and supplier.
- Long-term availability of facilities should be guaranteed for user countries.
- International support and recognition.
- Transparent project management.
- Use best knowledge and expertise.
- Active involvement of the IAEA
Immediate objectives
- A greed set of requirements for an international repository.
- a project plan over several years, would lead to implementation the repository.
- recommendations for specific actions by national and international organizations to enable implementation.
Waste management
Internationally coordinated recycling is cost efficient
Power generation
- A standalone variable high efficient generation
- Integration with the existing power generation systems
Economic outcomes
Solving the energy problem over more than 500 years stability with the existing limits.
Reduction of the cost 50%
Conclusions
- International management of the system is possible if there is a balanced political stability.
- World energy organizations need to serve all nations fairly.
- Taking into account other available energy resources, the portable reactors technology is a good choice for future power generation.
Note about the small portable reactors
Small portable reactors with solid moderators can provide very good nuclear energy production and the risk of melt down is very small because they are small in addition of the fact that the solid moderator locks the reactor if heat goes out of control.
These reactors are basically what is used in modern submarines. The technology is only available for military use in the US and Russia. A typical reactor size is about a large truck and can be moved out all together with no long term waste remains on the site after the reactor is consumed. Such reactors can serve a typical city of half a million people and they can be fully manufactured in a distance production site with no significant time for assembly on the operation site. They also can be returned for cleanup when they are consumed.
Three problems prevent a wide use. The technology is considered with high military value and it is strictly for military use. The second is that the distribution of many reactors brings risks of criminal and abusive activities. The third is the trend amongst world powers to stop using nuclear energy under the excuse of pollution is extended to these one even though they are not polluting. The true reason they want to keep them exclusive for the countries who have most of the row materials.
Annex 1. Operational Safety Environmental Political
Energy Analysis of Power Systems (March 2006) Critique of 2001 paper by Storm van Leeuwen and Smith: Is Nuclear Power Sustainable? and its May 2002 successor: Can Nuclear Power Provide Energy for the Future; would it solve the CO2-emission problem? with reference to a 2005 version entitled Nuclear Power, the Energy balance
Power plant operation
given as 2.8 PJ/yr, which compares with 1.1 PJ over 40 years in the Vattenfall 2002 life cycle study.
Power plant decommissioning
Suggested as being more than twice that for construction, but see above re Vattenfall life cycle study where it is aggregated with construction.
Uranium enrichment
3.1 GJ/SWU for centrifuge compares with actual 0.673 GJ/SWU at URENCO Capenhurst in 2001-02, including some capital works.
Spent fuel management
2.4 PJ initial + 0.6 PJ/yr compares with 4.3 PJ total in Vattenfall 2002 life cycle study.
Conclusion
The 2001 and 2002 Storm van Leeuwen & Smith papers and Background Information represent an interesting attempt to grapple with a complex subject but depend on many essentially speculative figures to put the case that nuclear energy incurs substantial energy debts and gives rise to minimal net energy outputs considered on a lifetime basis. Recent life cycle assessment (LCA) studies such as Vattenfall’s show figures around ten times lower for key capital and waste-related energy demands. The Vattenfall life cycle study gives a bottom line of 1.35% of lifetime energy output being required for all inputs, and only a tiny fraction of this being in the nature of energy debts.
Finally, it should be pointed out that, even on the basis of their assumptions and using their inaccurate figures, Storm van Leeuwen & Smith still are forced to conclude that nuclear power plants produce less CO2 than fossil-fueled plants, although in their view “the difference is not large”. Others might see a 20 to 50-fold difference (between nuclear and gas or coal) as significant. The audited Vattenfall figure for CO2 emission on lifecycle basis is 3.10 g/kWh, less than one percent of the best fossil fuel figure. This could approximately double if nuclear power inputs to enrichment were replaced by fossil fuel ones, but it is still very low.
It is clear, then that the concerns related to energy costs at the heart of the Storm van Leeuwen & Smith paper can be dismissed. The authors’ other point, that nuclear energy is not sustainable, is addressed in the Sustainable Energy and Supply of Uranium papers in this series.
United States Naval reactors
U.S. Naval reactors are pressurized water reactors, which differ from commercial reactors producing electricity in that:
- they have a high power density in a small volume and run either on low-enriched uranium (some French and Chinese submarines) or on highly enriched uranium (>20% U-235, current U.S. submarines use fuel enriched to at least 93%[1], compared to between 21-45% in current Russian models, although Russian nuclear-powered icebreaker reactors are enriched up to 90%), [citation needed]
- the fuel is not UO2 but a metal-zirconium alloy (c15%U with 93% enrichment, or more U with lower enrichment).
- they have long core lives, so that refueling is needed only after 10 or more years, and new cores are designed to last 50 years in carriers and 30-40 years in submarines.
- the design enables a compact pressure vessel while maintaining safety.
- The long core life is enabled by the relatively high enrichment of the uranium and by incorporating a “burnable poison” in the cores which is progressively depleted as fission products and actinides accumulate, leading to reduced fuel efficiency. The two effects cancel one another out.
Long-term integrity of the compact reactor pressure vessel is maintained by providing an internal neutron shield. (This is in contrast to early Soviet civil PWR designs where embrittlement occurs due to neutron bombardment of a very narrow pressure vessel.)
Reactor sizes range up to ~500 MWt (about 165 MWe) in the larger submarines and surface ships. The French Rubis class submarines have a 48 MW reactor which needs no refueling for 30 years.
The Russian, US and British navies rely on steam turbine propulsion, the French and Chinese use the turbine to generate electricity for propulsion. Most Russian submarines as well as all surface ships since Enterprise are powered by two or more reactors. US, British, French and Chinese submarines are powered by one.
Decommissioning nuclear-powered submarines has become a major task for US and Russian navies. After de-fueling, US practice is to cut the reactor section from the vessel for disposal in shallow land burial as low-level waste (see the Ship-Submarine recycling program). In Russia the whole vessels, or the sealed reactor sections, remain stored afloat indefinitely.